Set Up: CPU and Concurrent Connection Usage in cPanel
The CPU and Concurrent Connection Usage is a resource monitoring tool that lets you view detailed information about problematic processes and database queries running on your account. The information can then help you determine why a resource limit was triggered.
Depending on your account’s resource usage, you may see the following summary displays on the CPU and Concurrent Connection’s Resource Usage Overview page:
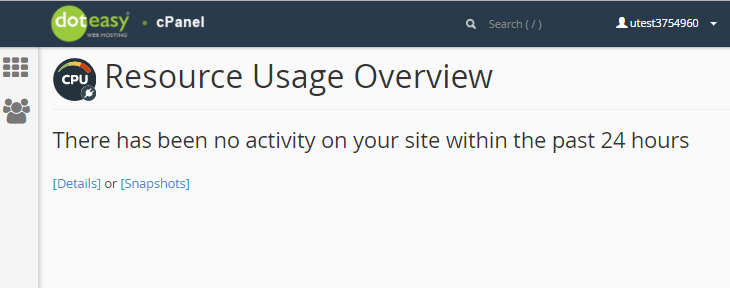
- There has been no activity on your site within the past 24 hours:

If you see this message, your account did not trigger any limits within the past 24 hours.
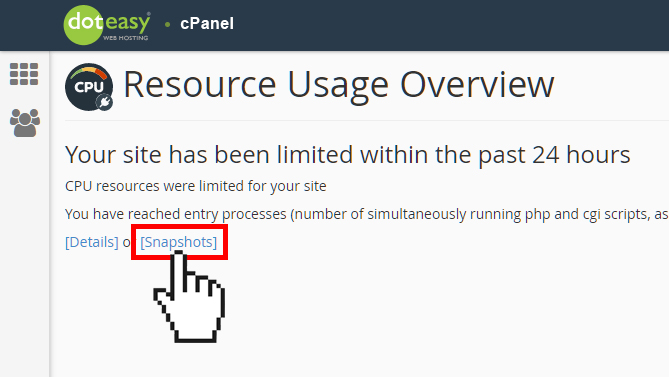
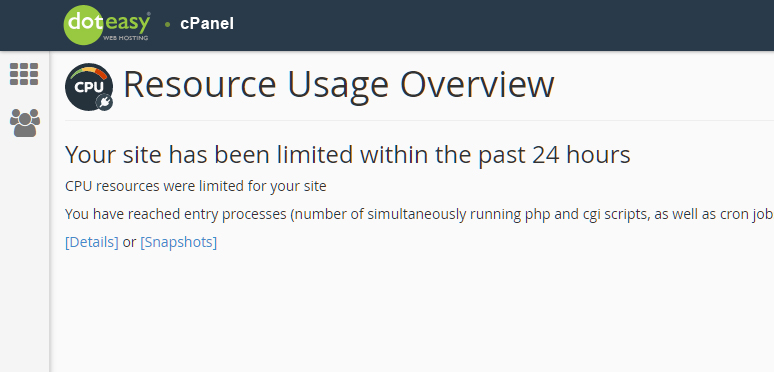
- Your site has been limited within the past 24 hours:
If you see this message, your account triggered at least one resource limit within the past 24 hours. cPanel displays additional information about which resource(s) triggered the limit.
- Your site might hit resource limits soon:
This message is a warning that your account may exceed resource limit in the near future. cPanel displays additional information about which resource is at risk of exceeding a limit.
Viewing detailed resource usage information
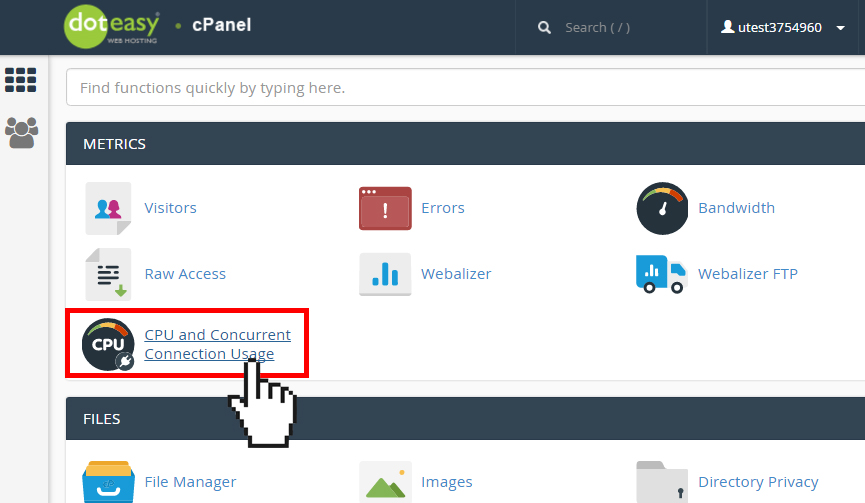
- Under Metrics click CPU and Concurrent Connection Usage.
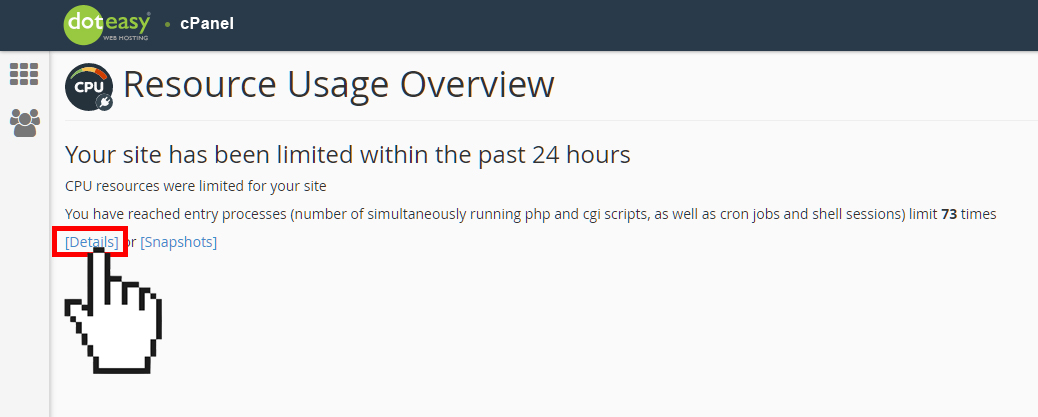
- Your account’s status will be displayed on the Resources Usage Overview page. Click on Details for more information.
- How resources are utilized will be displayed in the form of graphs and tabular data.
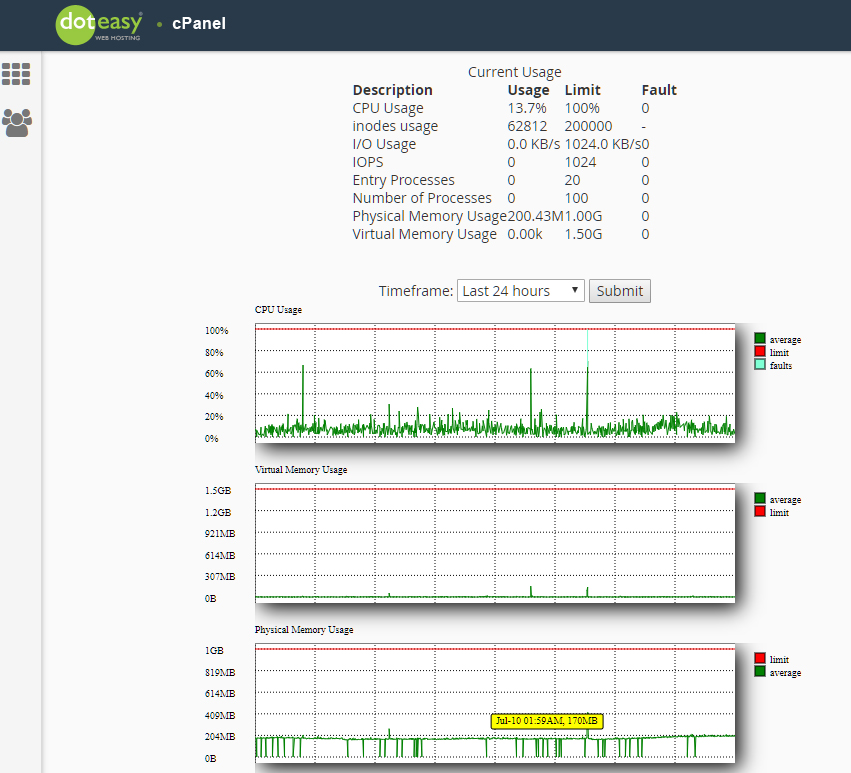
Understanding Current Usage stats
CPU Usage specifies how much of the allocated CPU resources your account is currently using. If CPU reaches 100% it means that your account is using all of the CPU resources allocated, and any new processes will be put in queue until existing processes complete. This can cause your website to slow down dramatically and even time out.
inodes Usage indicates the number of files and folders you have on your account. An inode is a record in your account’s disk table – each record represents information about a file or folder (such as its size, owner, etc., except data content and file name). The more files/folders you have, the more inodes you use; and the more inodes you use, the more system resources your account consumes. If your account has reached the maximum number of inodes, you may experience problems with uploading files, receiving emails, backing up your website properly, and seeing errors when accessing your website.
How to reduce the number of inodes your account uses?
Since the number of inodes equals the total number of files and folders on your web hosting account, to reduce your inode usage, you would have to reduce the number of files and folders on your account. This can easily be done by removing files and folders that you no longer need.
I/O Usage (input/output) represents how much I/O (or disk activity) your account is using. Simply put, it is the speed of data transfer between the hard disk and RAM. Every time you make use of the server disk drive (such as reading or writing to the server), you will consume I/O. Websites that stream a large number of media or that has many database records will have a higher I/O usage. In the event that your account nears your I/O limit, you will not see errors on your website. Instead, your website simply stalls while it waits for the data to transfer from the hard disk to the RAM.
IOPS stands for “Input/Output Operations Per Second”. It is a limit on the total number of read/write operations per second. When the limit is reached, the read/write operations stop until current second expires.
Entry Processes is the number of PHP, CGI, etc scripts you can have running at a single time. Note that this number doesn’t equate the number of visitors you can have on your website at a single time. An “Entry Process” generally takes only a second to complete. For example, if you run WordPress (which is written in PHP) on your website, each time a visitor comes to your homepage, the server will process the page request – that is one process. As soon as your homepage loads in their browser, it no longer counts as a process, until the visitor does something else to generate another process, say open another page on your website. However, if you notice a high Entry Processes number but you have a low traffic website, it could mean something is wrong with your PHP scripts – an entry process can also be caused by an outdated WordPress item, such as a plugin or even a theme.
Number of processes is the number of active processes your account can process simultaneously. This number includes all processes generated by your account
Physical Memory Usage (RAM) is the actual memory allocated for your account.
Viewing resource usage snapshots
Snapshots allow you to investigate the reason your account is hitting its limits.
- On the Resources Usage Overview page, Click on Snapshots.
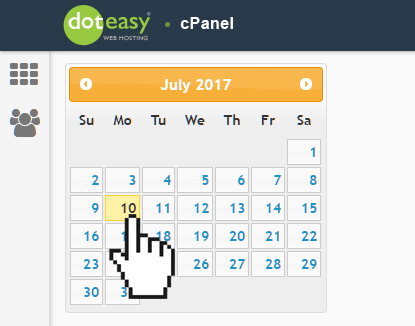
- Select the date you want to view from the calendar.
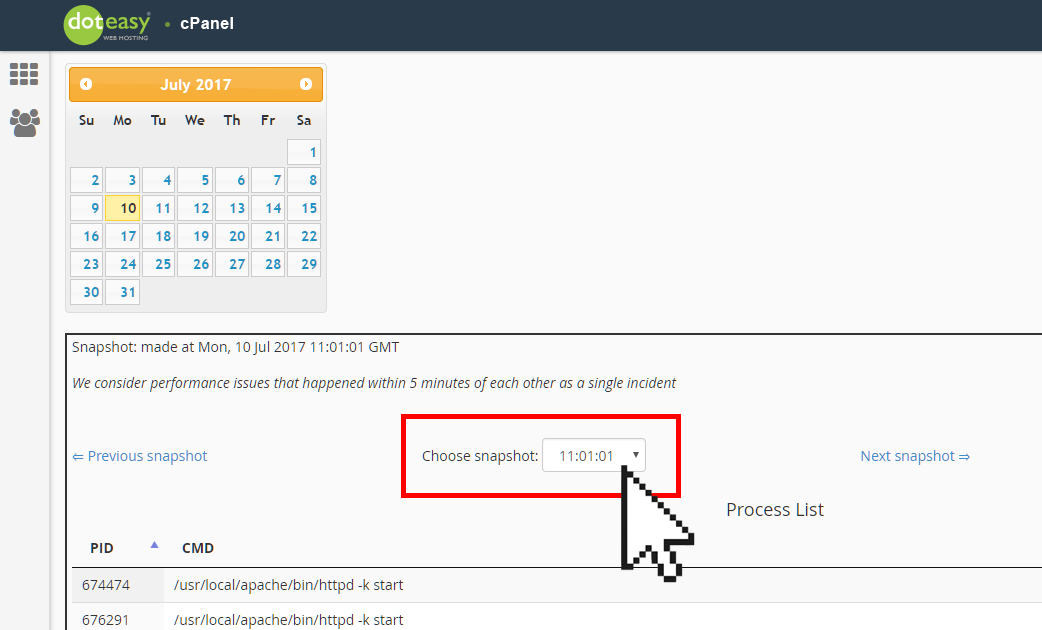
- From the Choose snapshot drop-down menu, select the snapshot for the specific time you want to view.
- You can use the Previous snapshot and Next snapshot to move to the previous or next snapshot(s).