Set Up: Understanding the Errors Metrics in cPanel
The Errors interface displays up to 300 of the most recent error log entries, in reverse chronological order. These errors may affect your website. Thus, you can use this interface to find and fix broken links and misconfigured web applications.
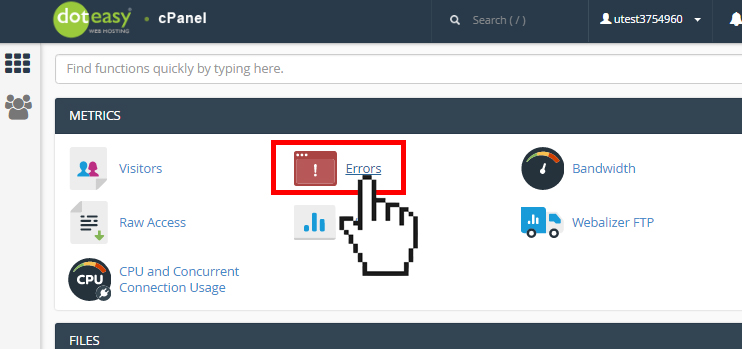
- Click on Errors under Metrics in cPanel.

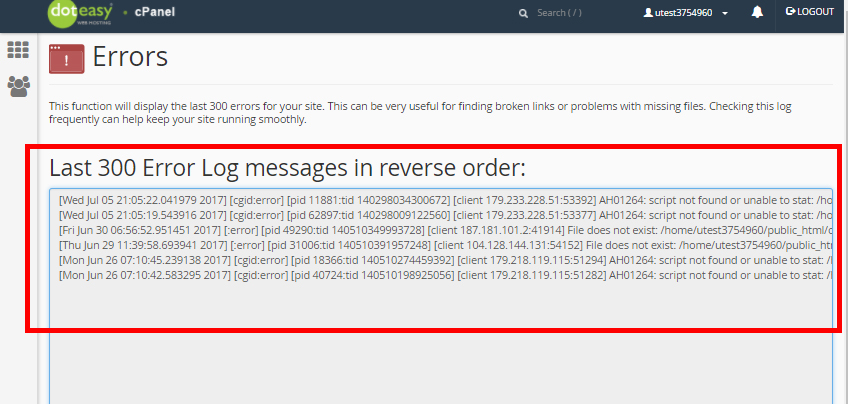
- On the Errors interface, you will find the last 300 Error Log messages displayed in reverse order:
Understanding an Error Log message
A typical log message looks like this:
[Thu Mar 13 19:04:13 2014] [core:error] [pid 35708:tid 4328636416] [client 72.15.99.187] File does not exist: /var/www/favicon.ico
The first item in the log entry is the date and time of the message.
The next item is the module producing the message (core, in this case) and the severity level of that message (error, in this case).
Following is the process ID and the thread ID of the process that experienced the error
Next, there is the client IP address that made the request.
Finally, you will find the detailed error message, which in this case indicates a request for a file that did not exist.